Section outline
-

-
 Video transcript
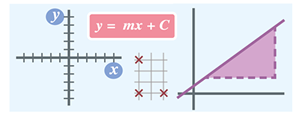
This unit of work is on straight line graphs
Video transcript
This unit of work is on straight line graphs
It can be difficult to prepare resources to teach straight line graphs and can be a challenge to teach because learners find it hard to understand the connections between a graph and its equation.
We are going to explore straight line graphs, investigating gradients as a measure of steepness and recognising them as rates of change.
We will also look at straight line equations and help learners to make connections between straight line graphs and their corresponding equations.
It is useful for learners to experience a range of graphs and learners will study a variety of scales and contexts.
This unit of work is just one of several approaches that you could take when teaching this topic and you should aim to adapt the resources to match ability level of your learners as well as your school context.
-
-
In this unit of work, we are going to look at straight line graphs. The suggested lessons teach the key ideas using a variety of different resources such as investigative tasks, card sorting, a bingo game and a treasure hunt.
For the teacher, straight line graphs lessons can be difficult to prepare. Whilst resources in this unit will support delivery of the content, you may also find it useful to access Graphing software such as Autograph or online resources such as Desmos or GeoGebra to create and display graphs for use during lessons. Having access to software that will draw graphs for them can save learners time and allows them to concentrate on investigating the connections between the equation of a graph and its properties.Learners will be very familiar with seeing graphs in different contexts. However, this doesn’t mean that learners will find linear graphs easy to work with. It is really useful for learners if they see a range of graphs including graphs in context.
It can be hard to establish the connection between a graph and its equation and learners may struggle to appreciate that every point on the graph has coordinates that fit the equation. They often have difficulty working with the properties of a graph and although they understand gradients as a measure of steepness they can be confused if graphs are drawn on axes that have different scales. Learners need to work with a wide range of different scales so that they are used to interpreting them.
Relating the properties of a graph to its equation can also prove difficult. Learners commonly misidentify which part of the equation shows the gradient and which tells us the y-intercept. It is important that learners understand that gradient is not just the slope of the graph, it is also a rate of change – an idea that is important in later units of work, as well as in other subjects, such as science.
This unit of work is just one of several approaches that you could take to teaching this topic and should be adapted to suit the ability of your learners.
-
-
Lesson 1 video
Video transcript
Lesson 1: What is gradient?
Look at this road sign. It tells road users the gradient of the road ahead.
25% is the same as one quarter. So we say this gradient is ‘1 in 4’. This means you go up 1 unit vertically for every 4 units horizontally. Let’s look at this on a diagram.
This car travels 1 unit up for every 4 units along. The gradient is the change in height divided by the horizontal distance travelled.
Some people call this rise over run. Here, the gradient is the change in height, which is 1, divided by the horizontal distance, which is 4.That’s 1 divided by 4, or one-quarter.
We often need to find the gradient of a straight line on a graph.
The gradient tells us the slope of the line. The larger the gradient, the steeper the slope. When we work with gradients on graphs, instead of saying the change in height divided by the horizontal distance travelled, we usually say the change in y divided by the change in x.
The gradient is the change in y divided by the change in x.
For this graph, the change in y is 2 and the change in x is 1 so the gradient is 2 divided by 1 - which is 2. Another way to think of this is that the graph goes up two units for every one unit across so the gradient is 2.
But what if the graph slopes in the opposite direction? We still work out the change in y divided by the change in x, but this time the answer is – 2. The negative symbol shows us the line is sloping the opposite way.
Another way to think of this is that the graph goes down two units for every one unit across, so the gradient is −2.
The key thing to remember is that the gradient tells us the slope of a line. You work out the gradient by calculating the change in y divided by the change in x.
-
-
How can these tools be used?
These resources are for use with any digital display in your classroom - including a projector, interactive whiteboard or any form of screen sharing technology. When selected, they fill the current available display. The resource is then ready for presentation and annotation.
As part of your ongoing Resource Plus subscription, we plan to include additional tools. We'd love to know your thoughts and ideas for further development.